Mastering Production Logging in Microservices – End-to-End Tracing With React Frontend & Backend
Modern cloud applications often consist of multiple microservices, deployed across distributed systems like Kubernetes. When something goes wrong in production, logs are the fastest way to understand:
- What failed
- Where it failed
- Why it failed
A mature logging strategy reduces MTTR (Mean Time to Repair), improves observability, and gives developer teams confidence during deployments.
This guide provides a complete production-ready logging approach with:
- Log levels and how to use them
- Structured JSON logs
- Async logging in Java
- Trace IDs across services
- Kubernetes logging
- Log aggregation & alerting
- Example of debugging a failed request from React → Java → Database
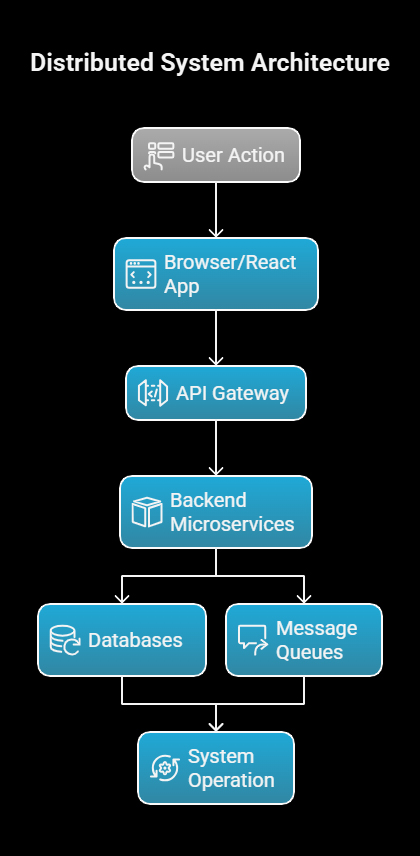
1. Why Logging Matters in Production
In distributed systems, a single user action might flow through:
- Browser/React app
- API gateway
- Multiple backend microservices
- Databases
- Message queues
If there is a failure, developers need to reconstruct the entire timeline.
Logs enable:
- Faster troubleshooting
- Transparent, auditable history of activity
- Automated alerting
- Monitoring performance trends
- Detecting security issues
Good logging tells the story without requiring code reading.
– Debugging without logs is like searching for a black cat in a dark room… that isn’t there.
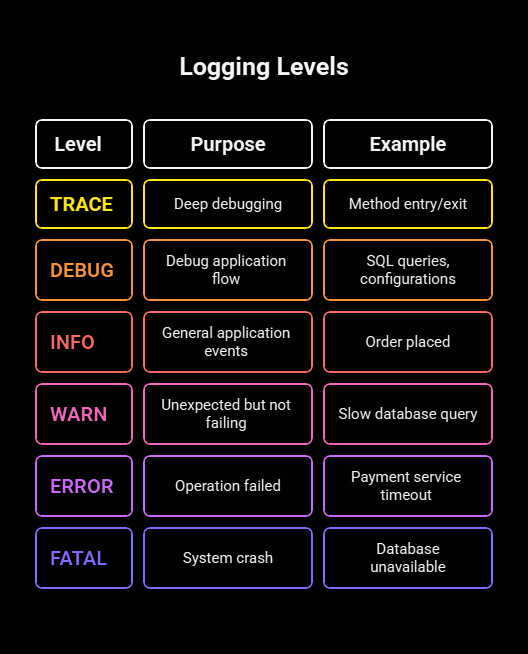
2. Log Levels – Use Correct Severity
Every log message should have a purpose:
Java example:
logger.debug(“Processing order ID: {}”, orderId);
logger.error(“Failed to process order ID: {}”, orderId, e);
| Level | Purpose | Example |
|---|---|---|
| TRACE | Deep debugging | Method entry/exit |
| DEBUG | Debugging information to understand the application flow | SQL queries, configurations |
| INFO | General application events (e.g., startup, shutdown) | Order placed |
| WARN | Unexpected but not failing | Slow database query |
| ERROR | Operation failed | Payment service timeout |
| FATAL | System crash | Database unavailable |
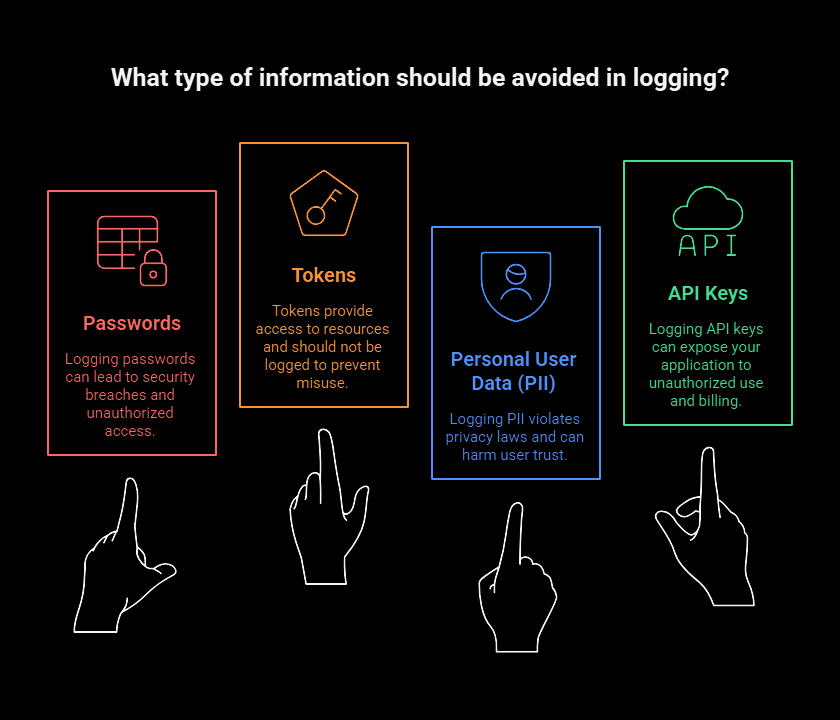
3. Never Log Sensitive Data
Avoid logging:
- Passwords
- Tokens
- Personal user data (PII)
- API keys
For compliance (GDPR, SOC, HIPAA), sanitize logs before writing.
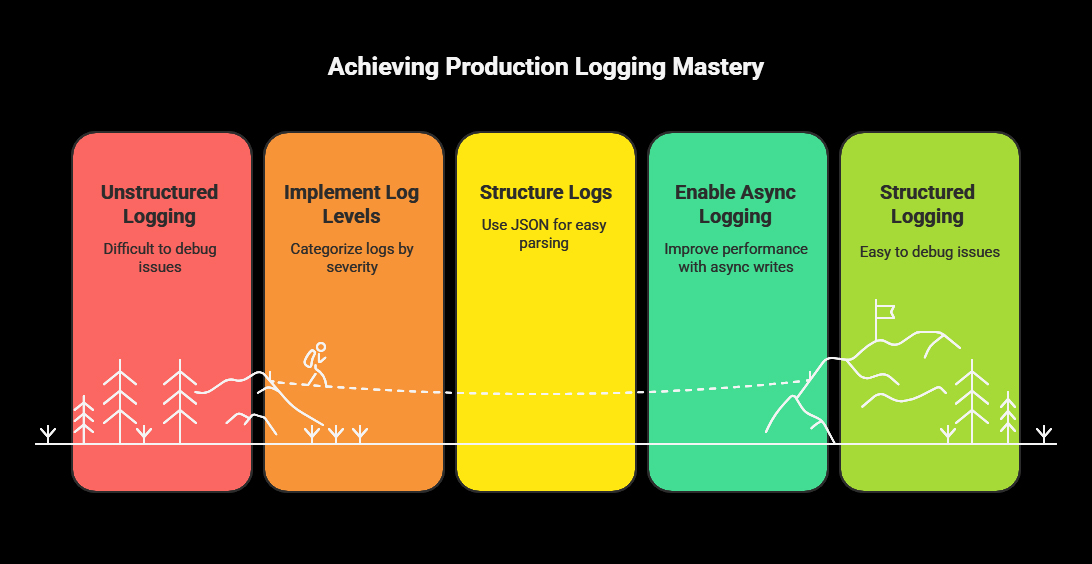
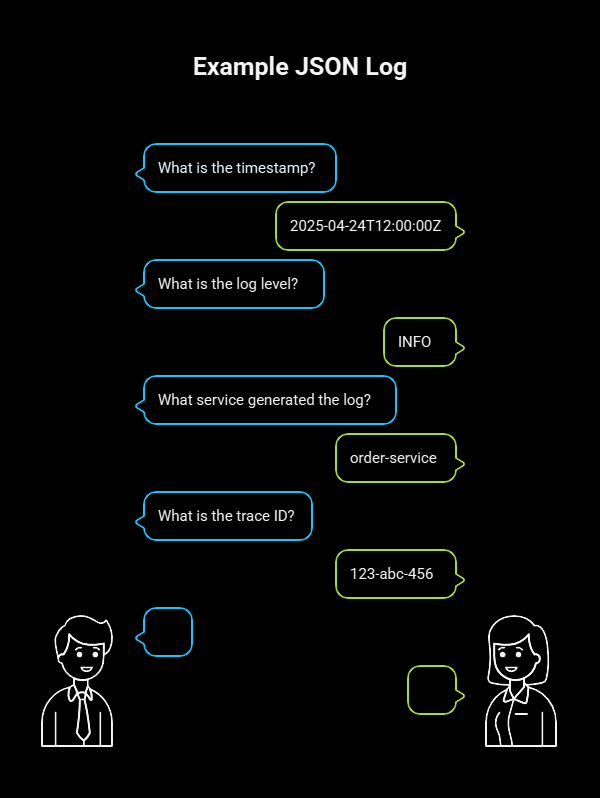
4. Use Structured (JSON) Logging
Plain-text logs are difficult to query. JSON logs allow indexing by:
- timestamp
- level
- traceId
- service
- errorCode
Example JSON log:
{
“timestamp”: “2025-04-24T12:00:00Z”,
“level”: “INFO”,
“service”: “order-service”,
“traceId”: “123-abc-456”,
“message”: “Order created successfully”
}
Tools like Elasticsearch, OpenSearch, OpenObserve, Loki, and Splunk can query these instantly.
5. Async Logging in Java (Log4j2)
Blocking logs slows down applications. Use asynchronous logging:
<Appenders>
<AsyncAppender name=”async”>
<AppenderRef ref=”Console”/>
</AsyncAppender>
</Appenders>
Benefits:
- Faster request processing
- Non-blocking threads
- Better performance under load
6. Add Trace/Correlation IDs
In microservices, every request must carry a trace ID, from frontend to backend.
In Java, add it to MDC:
MDC.put(“traceId”, UUID.randomUUID().toString());
In logs, this becomes:
{
“traceId”: “123-xyz-555”,
“message”: “Calling payment service”
}
This same ID will appear in:
- Client logs
- API gateway logs
- Each microservice
- Database access logs
This makes it easy to trace the complete flow across systems.
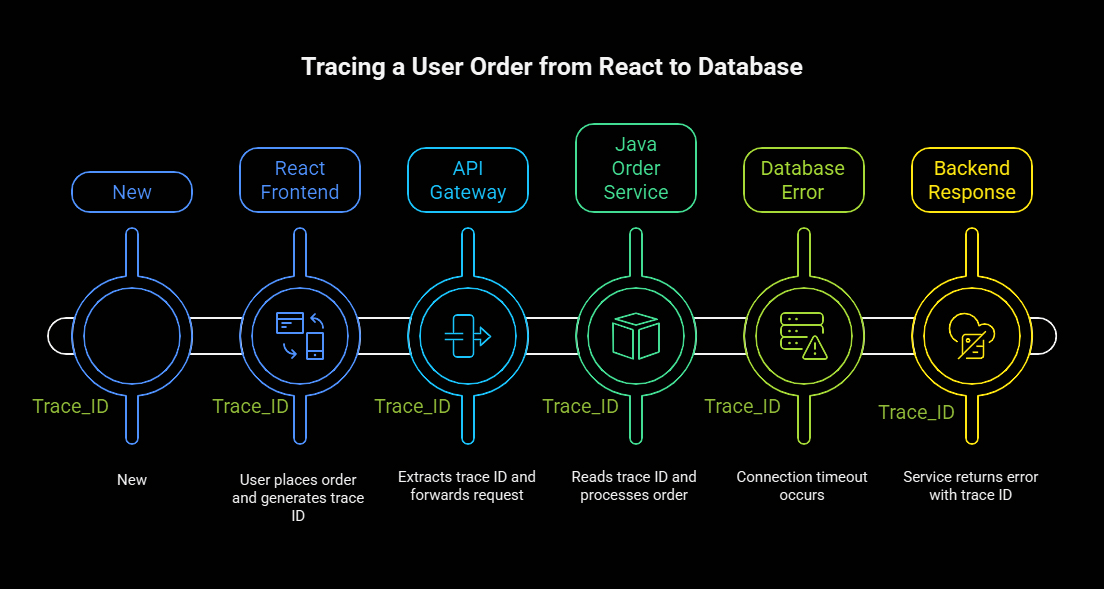
7. Example – Tracing a User Order from React → Java → Database
Scenario
A user places an order from React UI, but the backend responds
500 – Order could not be processed
We’ll trace the problem using logs end-to-end.
7.1 React Frontend
Before making API calls, we generate a traceId and send it in headers.
import { v4 as uuid } from “uuid”;
const traceId = uuid();
fetch(“/api/orders”, {
method: “POST”,
headers: {
“Content-Type”: “application/json”,
“X-Trace-ID”: traceId
},
body: JSON.stringify(orderData)
});
Frontend logs:
console.log(`[${traceId}] Creating order with amount ${amount}`);
7.2 API Gateway
Gateway extracts trace ID and logs in JSON:
{
“service”: “api-gateway”,
“traceId”: “b1f-a8d-99f”,
“path”: “/orders”,
“message”: “Forwarding request to order-service”
}
Then it forwards the trace ID to the backend:
X-Trace-ID: b1f-a8d-99f
7.3 Java Order Service
A filter reads trace ID and puts it in MDC:
String traceId = request.getHeader(“X-Trace-ID”);
MDC.put(“traceId”, traceId);
Service logs:
logger.info(“Processing order for user {}”, userId);
Final JSON output:
{
“service”: “order-service”,
“traceId”: “b1f-a8d-99f”,
“message”: “Processing order for user 500”
}
7.4 Database Error
Suppose the database connection times out.
Java logs:
logger.error(“Database connection timeout after {} ms”, 30000, e);
Log output:
{
“level”: “ERROR”,
“service”: “order-service”,
“traceId”: “b1f-a8d-99f”,
“message”: “Database connection timeout after 30000 ms”
}
7.5 Backend Response
Service returns:
{
“traceId”: “b1f-a8d-99f”,
“error”: “Order could not be processed.”
}
React logs it:
console.error(`[b1f-a8d-99f] Order failed – see logs`);
7.6 Result
With a single traceId (b1f-a8d-99f), the team can see the request lifecycle:
- React request
- API gateway forwarding
- Order service processing
- Database failure
This is real production observability.
8. Kubernetes Logging Best Practices
In Kubernetes:
- Apps write to STDOUT/STDERR
- K8s automatically collects logs
Benefits:
- No log files needed
- Works at scale
- Streams logs to collectors
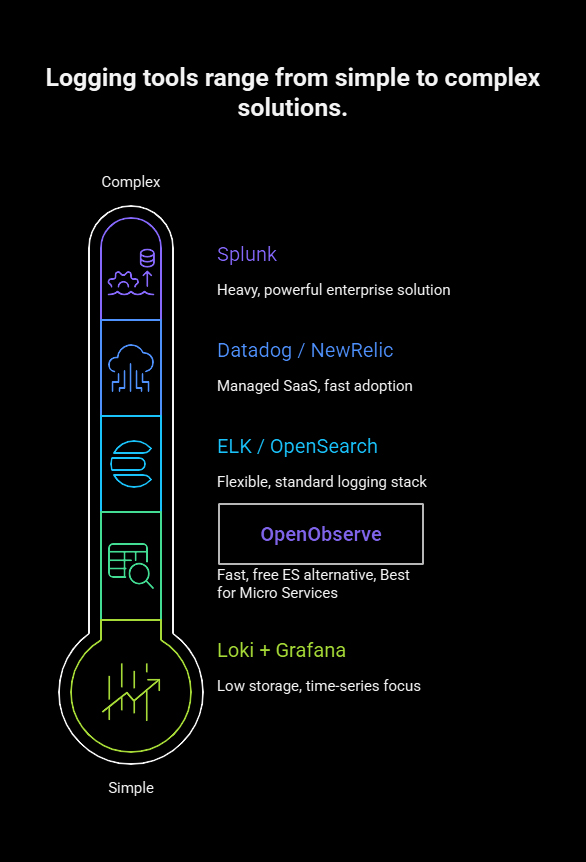
9. Log Aggregation & Analysis Tools
| Tool | Type | Notes |
|---|---|---|
| OpenObserve | Free, fast ES alternative | Excellent for microservices |
| ELK / OpenSearch | Standard logging stack | Very flexible |
| Loki + Grafana | Time-series logs | Low storage cost |
| Datadog / NewRelic | Managed SaaS | Fast to adopt |
| Splunk | Enterprise | Heavy but powerful |
10. Production Alerting Rules
Set alerts for:
- Error rate > baseline
- 5xx spike in the last 5 minutes
- Slow API response time
- Database failures
- Service not emitting logs (possibly dead)
Alerts should notify:
- Slack
- PagerDuty
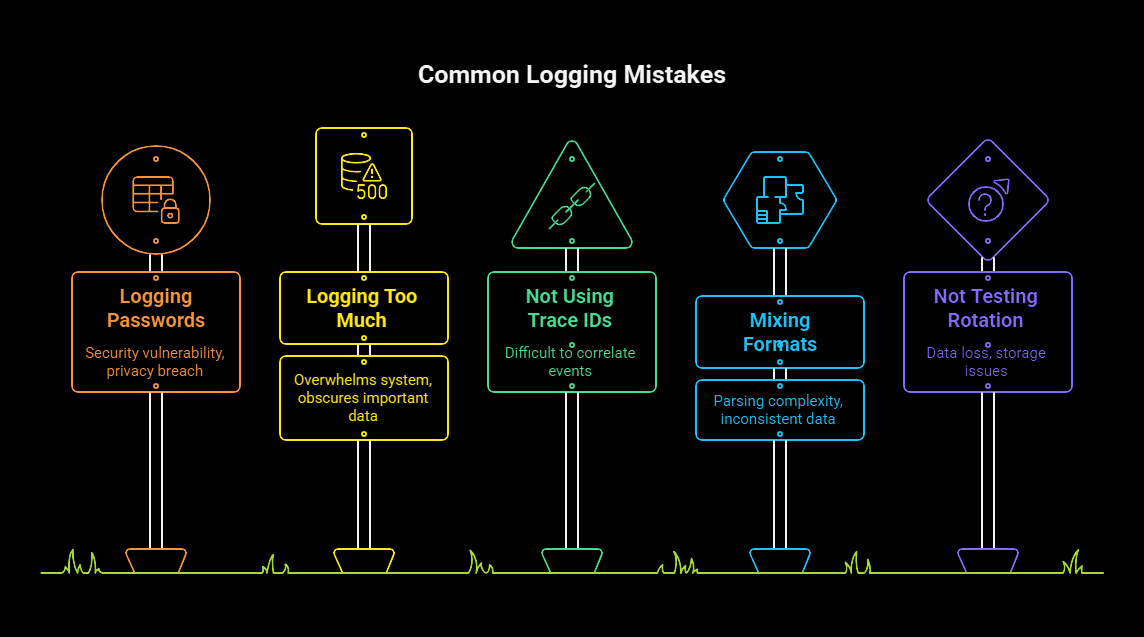
11. Common Logging Mistakes
- Logging passwords
- Logging too much
- Not using trace IDs
- Mixing formats (plain text + JSON)
- Not testing log rotation and indexing
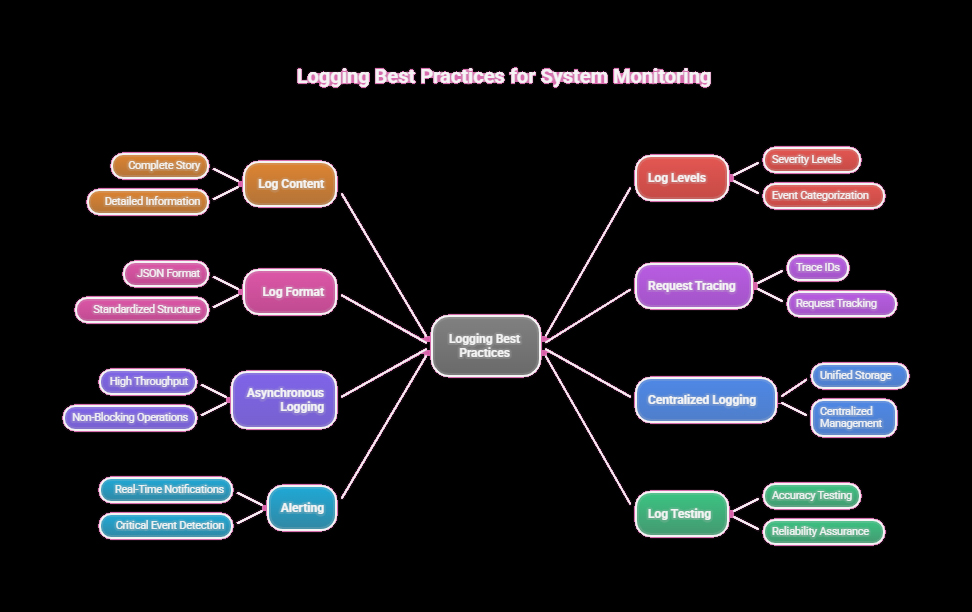
12. Best Practices Summary
- Logs tell the entire story
- Use the correct log level
- Always log in JSON
- Add trace IDs to every request
- Do async logging for high throughput
- Centralize logs
- Use alerts
- Test logs like you test code
13. Final Thoughts
Logging is not just for debugging errors—it’s a foundation for:
- Observability
- Security
- Performance insights
- Regulatory compliance
- Faster recovery
When every request can be traced end-to-end across the stack, your team can identify production issues within minutes instead of hours.
Ramgopal Lamrod
Always put your client first, this is the mantra of our Technical Project Manager Ramgopal. He’s one of the three-member team that started Sarvika Technologies and is responsible for building the complete eCommerce enterprise and managing multiple stores for the first client. A serious coder with a dash of naughtiness, Ramgopal carries more than twelve years of development experience and has a graduate degree in Computer Science. Off work, he enjoys gardening and taking up charity work to help the less privileged.